Today the lower Snake River dams (LSRDs) preform various functions; providing hydropower, navigation, irrigation and fish passage. Bonneville Power Administration bears almost all the costs of maintaining these functions, except for navigation, which is paid for by the federal government (taxes).
Topics: Hydropower, Navigation, Irrigation, Fish Passage, Costs
Hydropower
The four dams were built with six turbines each, a capacity to produce 3,033 MW of power. Though they have a high capacity, it is seldom realized. This is because no power plant is running at 100% capacity all of the time. In fact actual generation data shows they average 930 MW of power per year (2010-2015).
Generation is limited by both spill requirements and seasonal river flow. (Watch the crash course on energy here).
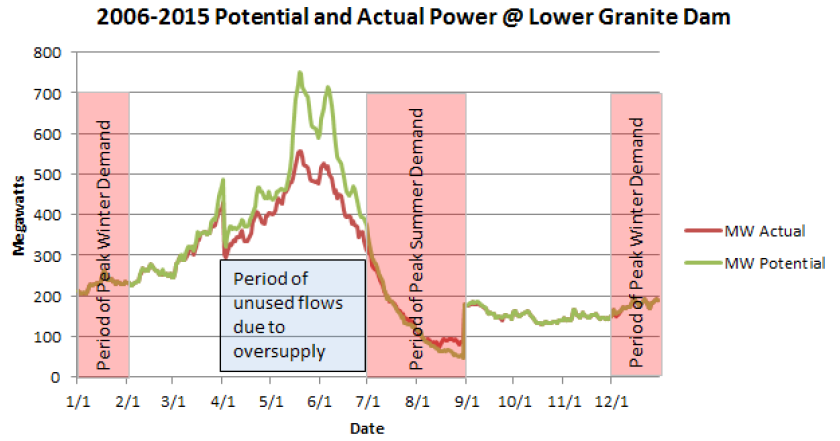
When demand for energy is high in summer and winter, the dams only contribute small amount of power, as shown for Lower Granite Dam, it’s potential is reached at 100-200 MW.
Currently the LSRDs average 5% of total hydropower sold by Bonneville Power Association….
and at anytime may contribute to the ~8,000 MW surplus sold on secondary markets – also known as interchange or tier 2 power sales. If the open market price for this power is below the tier -1 guaranteed power rate of $36MWh, money is being lost.
Look at real time amounts of energy being produced and sold on BPA’s website.
Fish Passage / Mitigation
Fish passage at the dams can happen a couple ways. Through the turbines, letting water over the spillway (there is mandatory spill the court has ordered to aid salmon passage), through the fish ladders (adults), through the juvenile fish passage system (where they enter a small orifice upstream and are counted as they travel through the pipe to the other side) and finally they utilize barges and trucks to transport juveniles downstream.
Money is spent on all these strategies to get more salmon past the 8 dams in their way, ensure they can get through as quickly as possible, and that they have the highest probability of surviving, without negative effects (latent mortality).
Unfortunately, none of this has worked, less and less wild fish return each year (see salmon and steelhead for more metrics).
To make up for the declining runs, hatcheries are subsidized, and this is another large expense for BPA called “mitigation”. The department of fish and wildlife manages the 26 facilities that release millions of salmon a year. Once they are released, they are subject to similar undesirable conditions as wild fish are, as they migrate through the system to and from the Ocean.
Further mitigation: In the past few years, BPA has begun culling and disturbing sea lion and birds. This is based on research and observation that birds and sea lions’ diet includes young salmon. Sea lions gather at the mouth of the Columbia waiting for the salmon, and some are intelligent enough to detect the barges and trucks that will release their next meal. Birds like double crested cormorants nest on shorelines and islands while they feed, only to be killed, chased away or have their habitat destroyed. This controversial recovery method is at odds with the migratory bird act. Justifying this action takes the spotlight away from negative impacts of the dams, scapegoating and pinning the problem on other species. As the federal agencies become more desperate to recover salmon, we must hold them accountable to stop the use of this method, and start seriously considering breaching.
“From 2015 to 2017, the Fish and Wildlife Service authorized the lethal removal of Doublecrested Cormorants in the Columbia River estuary. More than 5,000 cormorants were removed and more than 6,000 nests were destroyed.” – Letter from to U.S. Fish and Wildlife
Navigation
The 2009 Washington State Marine Forecast projects the growth of freight transportation on the Lower Snake from 2003-2030 to be 0.3 percent.
Barging on the lower Snake River from Lewiston through Ice Harbor Dam is in serious decline. Over the past 18 years, freight volume has declined 69 percent, and container shipments from the Port of Lewiston, the only port on the river that ships containers, had dropped at least 82 percent by early April 2015—and 100 percent by late April 2015. The 2009 Washington State Marine Forecast projects the growth of freight transportation on the lower Snake from 2003-2030 to be 0.3 percent. Today even this projection is proving too optimistic.
show / hide
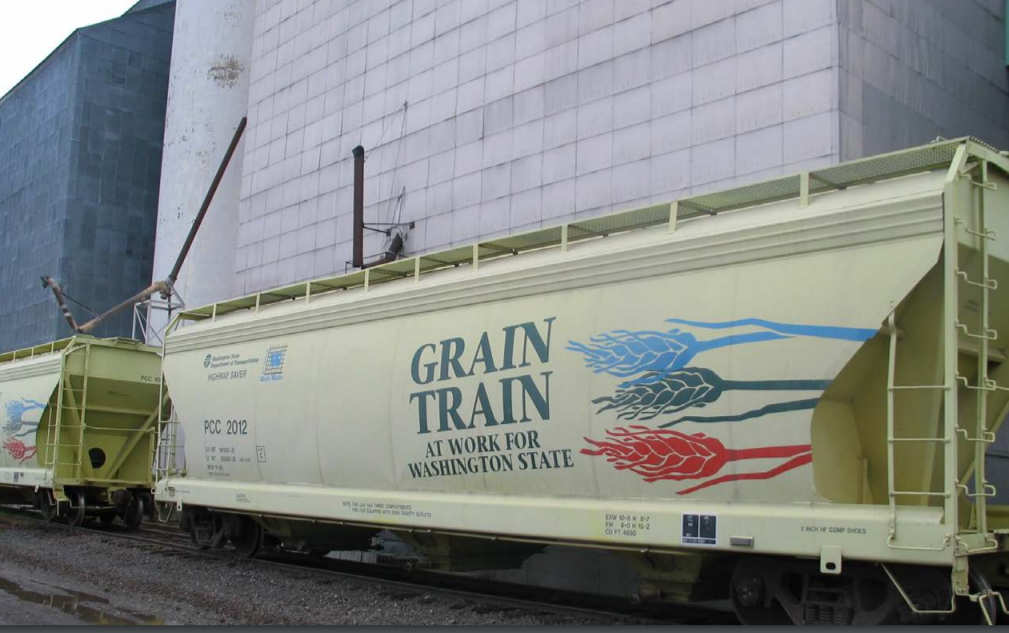
Increased rail fuel efficiency and the growing use of unit trains in Montana, Idaho and Washington have contributed to a shift from truck-barge to truck-rail for the shipment of grain to Pacific Northwest ports. Two unit train grain terminals have come on line in eastern Washington in the last 11 years, and a third is being built west of Spokane and will be fed in part by short lines that penetrate the Palouse Prairie. Washington State is investing in bridge improvements so these short lines can service heavier cars at higher speeds.
A 2014 study by the Lewis Clark Valley Metropolitan Planning Organization cited rail improvements and construction of a unit train loader at the Port of Lewiston as the number one priority for improved transportation in the Lewiston area.
container shipments down drastically at Port of Lewiston
Containers shipped to ports on the lower Snake River are measured in TEUs, which means Twenty Foot Equivalent Units, a standard global measure for sea freight. What it means is that every 20 linear feet worth of loaded containers counts as a single TEU. The Port of Lewiston’s container shipments peaked in 1997 with 17,611 TEUs and have been on a long, steady slide ever since. In fact, the Port suspended 100 percent of its container traffic indefinitely in April 2015.
Data source: Port of Lewiston (portoflewiston.com). For more graphs, click on the below headline.
tons shipped through Ice Harbor Dam trending down
Ice Harbor Dam is lowermost of the four lower Snake River dams and therefore offers the best indication of the entire waterway’s economic viability. Shipping statistics from Ice Harbor indicate water-born commerce peaked on the lower Snake in 1995 and has been on a long, steady decline ever since.
Data source: Walla Walla District of the U.S. Army Corps of Engineers (nww.usace.army.mil). For more graphs, click on the above headline.
freight transportation
In 1995 freight transportation on the lower Snake River peaked at 9.16 million tons. By 2000 that volume had dropped to 4.52 million tons, and in 2014 the lower Snake waterway transported only 2.8 million tons. Over the past 20 years the volume of freight transported on the lower Snake River has declined by 69 percent.
- The U.S. Army Corps of Engineers uses ton-miles to represent the value of a waterway for commercial navigation. A high use waterway produces 300-500 billion ton-miles each year. Any waterway under 0.5 billion ton-miles is considered a waterway of negligible use. The lower Snake River logs 0.3 billion ton-miles annually. If the river’s 2014 freight volume were to more than double, ton-miles would increase to 0.4, and the waterway would still remain in the negligible use category.
- Since 2000, container-on-barge traffic on the lower Snake River has declined by 82 percent, with more than half of that decline occurring prior to the great recession, which commenced in fall 2008.
- Major regional industries have abandoned barge shipping. For example, Clearwater Paper, Lewiston Idaho’s largest employer, is located 2 miles from the Port of Lewiston and exports paper and paperboard. Clearwater Paper now ships 95 to 100 percent of its product by truck and rail. With several large sawmills in the region, the Port of Lewiston has not shipped any lumber for at least seven years.
- Beginning with the 2002 Lower Snake River Juvenile Salmon Migration Feasibility Report, all projections of future levels of freight volume on the lower Snake River have been vastly overstated. Even the 2009 Washington State Marine Cargo Forecast prediction of 0 percent growth from 2002-2030 has proven to be much too optimistic.
- The cost of maintaining the lower Snake River waterway is growing rapidly. The Army Corps of Engineers recently acknowledged an annual cost of $7.6-$12.6 million just for operations and maintenance of the waterway. In addition to normal maintenance and operations, and sediment management planning costs, dredging recently cost more than $23 million for the upper part of the Lower Granite pool, with more implementation costs to follow.
- The Walla Walla District’s claim in its 2014 Lower Snake River sediment management plan that the lower Snake River waterway provides cost savings of $8.45 per ton is false. The Walla Walla District derived this figure from the 2002 Lower Snake River Juvenile Salmon Migration Feasibility Report, which claimed a savings of $5.75 per ton, a figure based on an earlier study of shipping volumes on the deep draft section of the Columbia River downstream from Portland. The 2002 economic analysis of transportation on the lower Snake violated Corps guidance regarding the use of rates rather than costs and was based on a highly overstated projection of future freight volumes. The transportation economics part of the 2002 study was so flawed the Walla Walla District itself stated the results should not be used again without further refinement. The current use of this savings figure by ports and special interest organizations is unsubstantiated propaganda. You can read more about it here.
- A reanalysis of the 2002 Lower Snake River Juvenile Salmon Migration Feasibility Report demonstrates the Army Corps’ Walla Walla District underestimated the average annual cost of keeping the lower Snake River dams in place by a staggering $160.7 million.
The lower Snake River project is economically unjustifiable and fiscally unsustainable. In addition to direct taxpayer costs, the many benefits lost from maintaining this project—from vastly improved sports and commercial fisheries to alternate investment in a transportation system that can benefit a much wider range of businesses — make the early removal of the four lower Snake River dams imperative.
Irrigation
There are an estimated 37,000 acres of industrial farmland irrigated by the reservoir behind one dam, Ice Harbor.
no flood control
Congress did not authorize flood control as a purpose and the dams were not designed for it. They are “run of the river” dams, meaning they were not built to store water. Due to sediment build up, Lower Granite Dam actually creates a flood risk to Lewiston, Idaho and requires conveyance dredging to mitigate this risk.
Costs
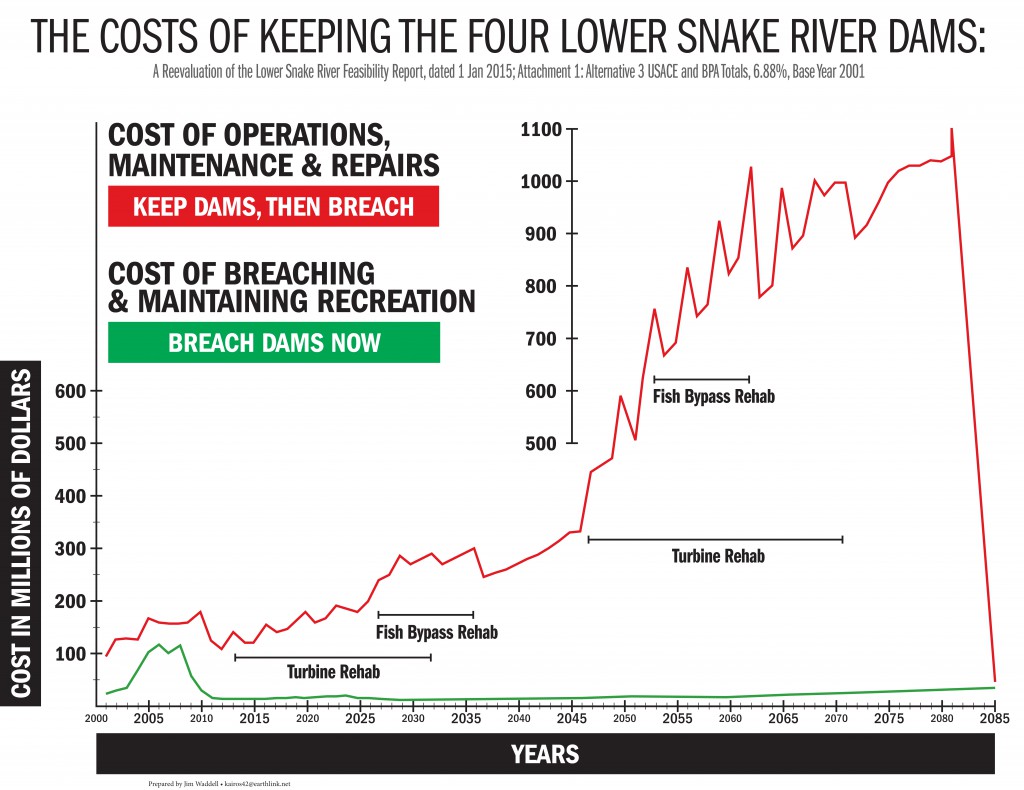
The rapidly rising costs of maintaining the lower Snake River system are presenting significant challenges to the federal agencies that manage the dams. The cost of mitigation hatcheries for lost Snake River stocks is rising a rate of 5 percent annually, and turbine rehabilitation over the next 15 years will require at least $775 million in today’s dollars. A growing set of cost indicators suggest the government can’t continue propping up the system.
-
- The National Academy of Sciences’ 2012 report analyzing the U.S. Army Corps of Engineers’ portfolio of aging infrastructure showed that the Corps is in “an unsustainable situation for maintenance of existing infrastructure.”
- Declining federal budgets imply the improbability of large injections of cash into the Corps’ budget generally and the lower Snake River project specifically. Freight transportation on the lower Snake is so low that the waterway falls into the Corps’ category of a river of “Negligible Use.”
re-imagining the future
With the support of elected officials, the Corps has the authority and the time to update the 2002 EIS now and still act this year.
The dams are aging, and escalating costs of necessary maintenance—paid for with tax and rate payer dollars—are stressing already-tight federal agency budgets. Freight transportation has declined drastically as the combination of trucks and railways have become more efficient than trucks and barging. The dams produce hydro-power at a fraction of their capacity, and affordable replacement options are already in place, or readily available. The dams do not provide flood protection or any meaningful amount of irrigation.
Economic benefits of the dams are far below the costs (benefit to cost ratio of .15, meaning 15 cents in benefits to every tax dollar spent). Costs for operation and repairs currently exceed power revenues and economic benefits derived from navigation and irrigation.
Corrected Cost and Economic conclusions based on Corps data and planning processes show breaching via channel bypass has benefits ranging from 4 to 20 to 1 with Regional effects adding more than 5K jobs in E. Washington and Lewiston.
Irrigation pumps could be replaced and pipes extended to the Snake River for farmland irrigated behind Ice Harbor Dam. Or, the land could be converted to non-irrigated farmland or pasture. Either option would cost far less than maintaining the salmon-killing dams.
Reference Policy Considerations
We now have excellent examples of indisputably successful dam removal and river restoration projects: the Elwha and Glines Canyon dams on the Elwha River of Washington state, Condit Dam on the White Salmon of Washington state, four dams on the Penobscot River in Maine and Marmot Dam on the Sandy River in Oregon. The widely-celebrated removals of these large dams has reduced taxpayer waste and restored fisheries, injecting additional dollars into rural economies.