2017 September Snake River fish return summary
Posted /UncategorizedOverall Chinook Returns as of 9/29/17:
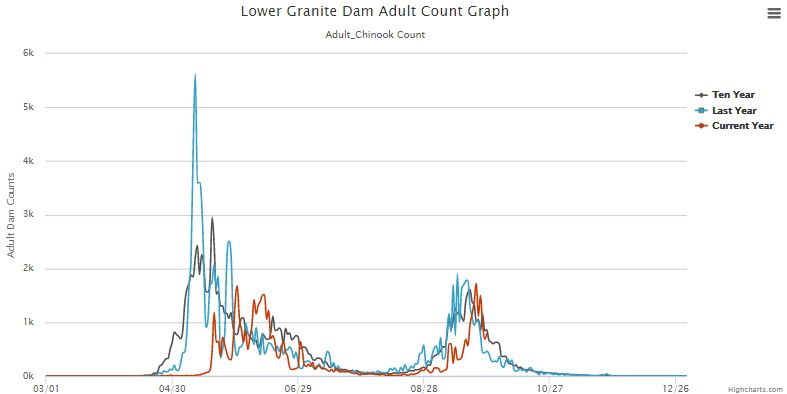
2017: 53,044
2016: 103,355
10 year average: 106,942
Spring Chinook Returns

2017: 27,357
2016: 62,050
10 year average: 62,403
Summer Chinook Returns
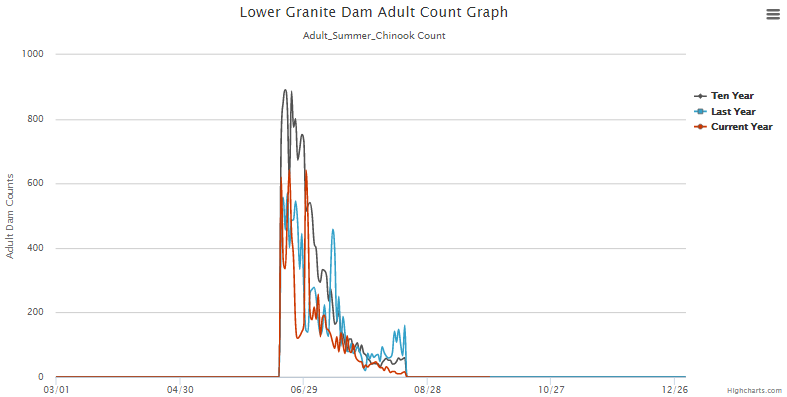
2017: 8,952
2016: 12,110
10 year average: 17,232
Fall Chinook Returns (as of 9/29/17, run is still going)
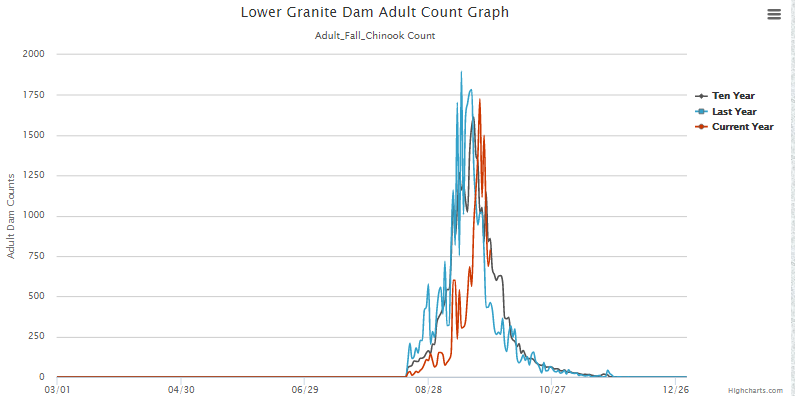
2017: 16,733
2016: 29,195
10 year average: 27,307
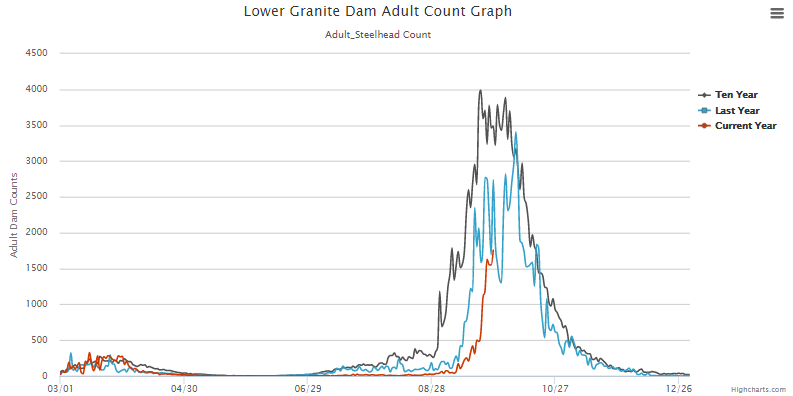
Steelhead Returns (as of 9/29/17, run is still going)
2017: 21,047
2016: 40,517
10 year average: 82,660
Sockeye Returns
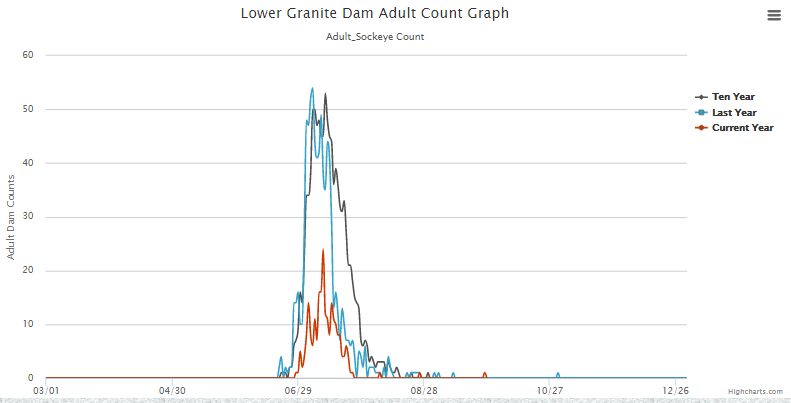
2017: 228 to Lower Granite Dam, 157 of those made it back to Red Fish Lake.
2016: 815 to Lower Granite Dam, 595 of those made it back to Red Fish Lake.
10 year average: 1,062 to Lower Granite Dam, 690 of those make it back to Red Fish Lake.
If you are tired of fishing season closures, Southern Resident orca deaths, and your power bill going up, give your local elected officials a call. They need to know that you want change. Let them know that the ONLY solution to these problems is to mothball the 4 lower Snake River dams.