Transportation Methods, Greenhouse Gas Emissions, and the Lower Snake River Reservoirs
Transporting goods by barge is not so green, after all.
John Twa, Mechanical Engineer

The four lower Snake River locks and dams were completed in the 1960’s and 1970’s after congressional authorization to provide river navigation to eastern Washington and Lewiston, Idaho. Each of the four, 100 foot high dams created flat water reservoirs with sufficient depth to allow freight traffic by barge. Traffic peaked in the mid to late 1990’s and has steadily declined since. Navigation maintenance costs have not gone down with traffic, as regular lock repair and river channel dredging is still necessary. Prior to the flooding of the Snake River, freight was hauled mostly by rail and also truck.
Conventional wisdom considers barging an
“environmentally friendly” form of freight transport, with
fewer gallons of fuel burned per tonne-kilometer than
train or truck. Based only on fuel consumption,
greenhouse gas emissions appear to be low when
compared to rail and truck transport. Emission rates per
tonne-kilometer based on fuel alone are shown at right.
The graph, however, does not include methane, a potent greenhouse gas that causes climate change. Methane is released by slow flowing reservoirs at much higher rates than from free flowing rivers. Reservoirs in tropical regions have shown the highest emissions, but methane has been measured on
the lower Snake River reservoirs also. A recent analysis shows the potential for at least 50,744 metric tons of CO2 equivalent emissions per year from these four reservoirs.
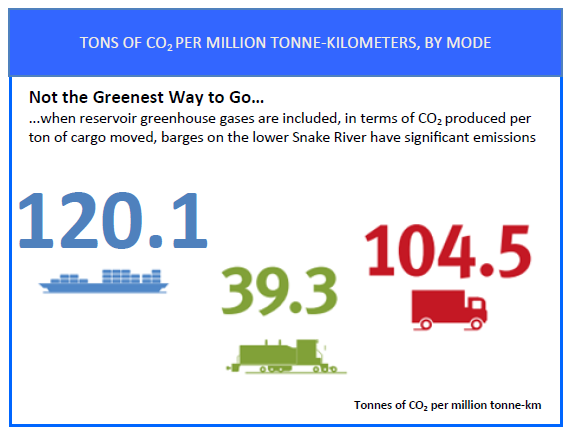
With the reservoirs themselves being an integral and
inseparable component of barging, the emissions of the
reservoirs should be combined with the barge emissions
rate for comparison to other forms of freight transport.
For the lower Snake River in 2015, with 2.7 million tons of
freight traveling the full length, the emissions rate of
barging jumps from 28.2 to 120.1 tonnes of CO2 per
million tonne-kilometer. Barging becomes the least
desirable and most environmentally destructive form of
freight transportation in the region, with emissions three
times greater than rail emissions.